Football Data Portraits
2026 · Self-initiated
Every match of World Cup 2026 turned into a generative data portrait. All 104 matches rebuilt in 3D, each from about 1,500 real logged events. No AI, nothing staged.
The task
Self-set. No client and no brief. A personal project that ran alongside the 2026 World Cup: every match rebuilt from its own event data while the tournament was still on.
The result
All 104 matches, one portrait each, live at wc26.bogachev.fr. Around 9M views and 130K+ likes and comments across X, Instagram, LinkedIn and Reddit, with 1.8M views for the Argentina comeback alone. 167,000 views on the site itself, almost 3 portraits per visitor, and an Instagram account that went from zero to 6,000 followers in a month. Featured by Fast Company, FlowingData and Datawrapper. No ads, no partnerships: it spread on its own.
Project sheet
- My role
- Everything, solo. Concept, data pipeline, 3D engine, design, code, promotion.
- Data
- About 1,500 logged events per match. Shots, goals, cards and expected goals from Opta via WhoScored; per-minute momentum from FotMob.
- Built with
- Three.js and WebGL for the portraits, a Python pipeline for the data.
- Reach
- 9M views and 130K+ likes and comments across X, Instagram, LinkedIn and Reddit. 167,000 views on the site, almost 3 portraits per visitor.
- When
- June to July 2026, the length of the tournament. 104 matches, one portrait each.
How a portrait reads
How a match becomes a landscape
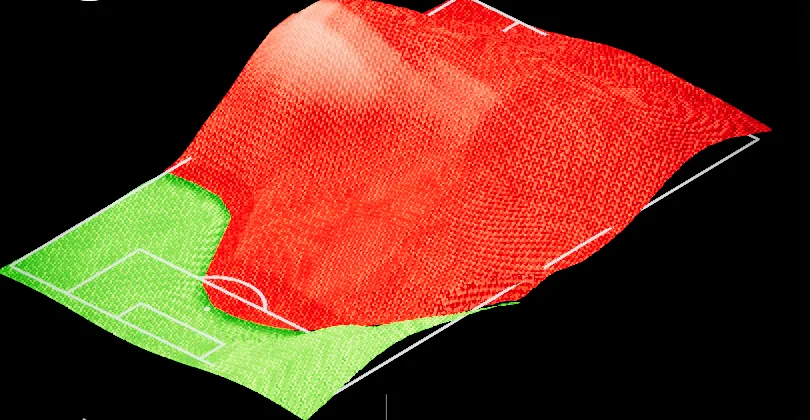
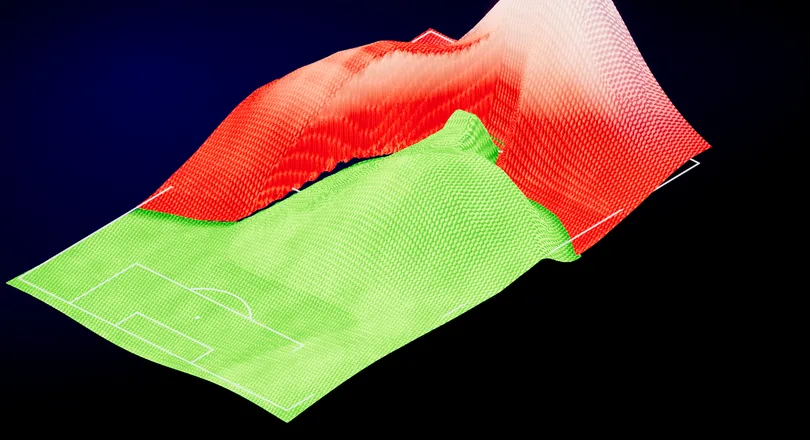
Nothing on screen is footage, and nothing comes from tracking data. Each portrait is built from the match’s logged event stream: every pass, touch, shot, tackle, card and substitution, each one stamped with a minute, a second and a spot on the pitch. Shots, goals, cards and expected-goals values come from Opta data via WhoScored. A second source, FotMob, supplies the per-minute momentum signal that drives the territory tide, the lean of the sky and the pulse along the bottom edge.
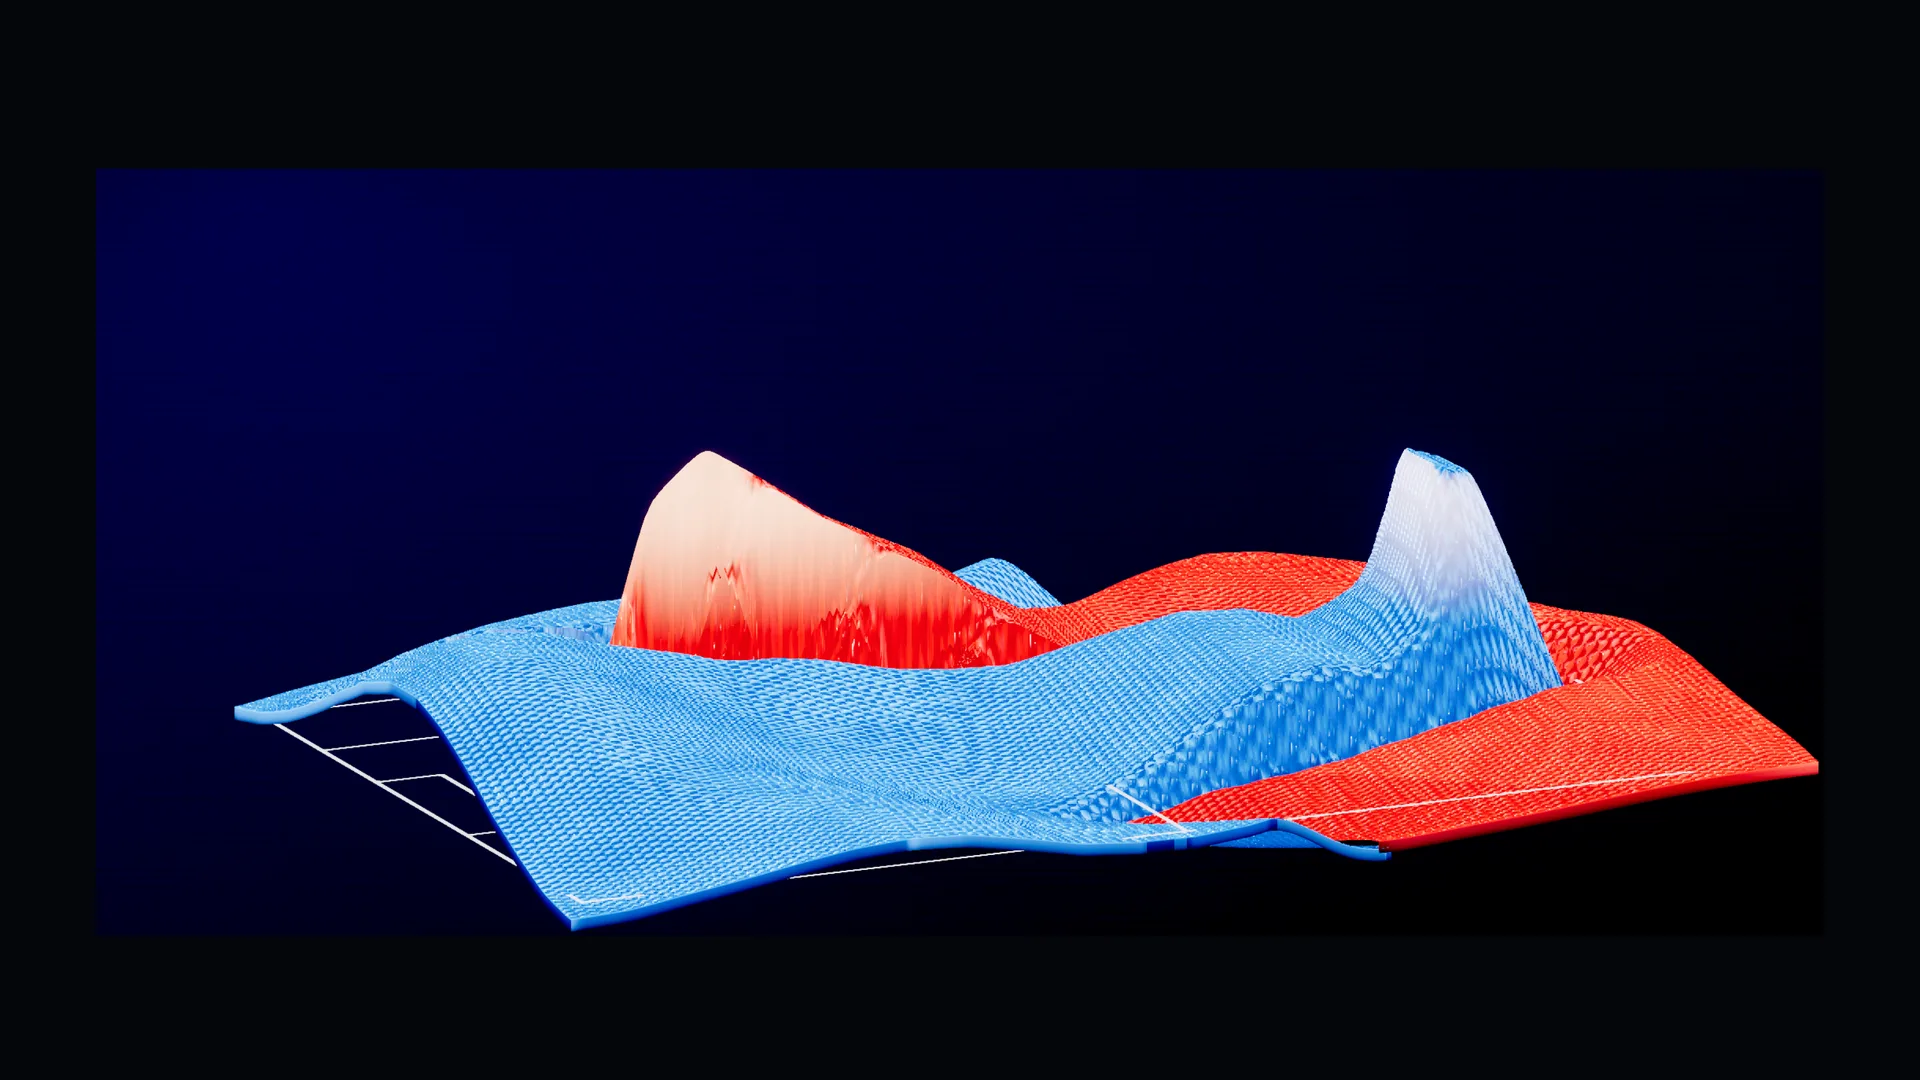
Two cloth blankets, one in each team’s national colour, lie over the pitch and meet along a moving seam. Together they cover the whole pitch, and the fabric belongs to whoever controls that ground. As one side presses, its colour advances across the halfway line and camps in the opponent’s half. When the game turns, the front rolls back.
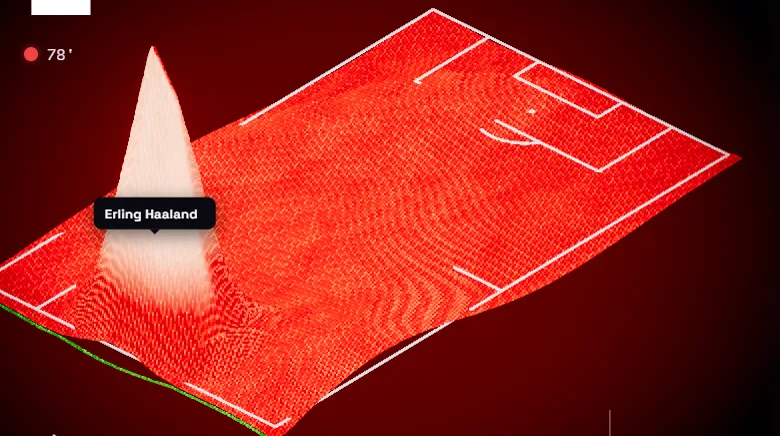
Hills rise out of the cloth wherever shots happen, at the exact spot the chance was taken. Their height is the expected-goals value of that chance, so a real opening lifts a tall spire while a hopeful effort from distance barely creases the fabric. A goal floods the whole pitch in the scorer’s colour, and it gets a crest of its own regardless of how likely it was.
Above the pitch the sky leans toward the team in front. Along the bottom, a momentum trace spikes toward whichever side is on top, minute by minute. When a knockout tie goes to penalties, the piece closes with the shootout, each kick scored or missed in order.
The rule the project set itself
The About page states it in one line:
No mock data, no procedural noise for decoration. If a hill is there, a shot was taken; if the front moved, the momentum moved with it.
The same page is equally direct about where the model bends. The front and the relief are smoothed, so the cloth breathes instead of flickering, and what you read is an interpretation of the flow rather than a per-second record. Territory is reconstructed from the event stream, which makes it the shape of play rather than exact positions. The clock runs on dramatic time, lingering on goals and big chances and racing through routine passing. The order of events is faithful. Only the pacing is warped, and on purpose.
Why football
Football is one of the few data-rich subjects a global audience already reads fluently, which makes it a bridge between a serious analytical dataset and a viewer who has never opened one. The stated aim is functional art, a piece whose beauty comes from being true, so that a lifelong analyst and someone watching their first World Cup can look at the same image and see the same game.